library(tidyverse)
library(ggrepel)
library(robustbase)
library(PerformanceAnalytics)

library(robustX)Detecção Outliers Multivariados
BACON
Blocked Adaptative Computationally Efficient Outlier (BACON)
df <- starwars[c(2,3)] |> drop_na()
bacon <- df |> BACON()
rank(x.ord[1:m,] >= p ==> chosen m = 8
MV-BACON (subset no. 1): 8 of 59 (13.56 %)
MV-BACON (subset no. 2): 32 of 59 (54.24 %)
MV-BACON (subset no. 3): 45 of 59 (76.27 %)
MV-BACON (subset no. 4): 48 of 59 (81.36 %)
MV-BACON (subset no. 5): 51 of 59 (86.44 %)
MV-BACON (subset no. 6): 51 of 59 (86.44 %)names <- starwars[c(1,2,3)] |> drop_na()
df_final <- cbind(bacon$subset, names) |>
mutate ("bacon$subset" = !`bacon$subset`)
df_final <- cbind(bacon$dis, df_final)Correlações
chart.Correlation(df_final[c(4,5)])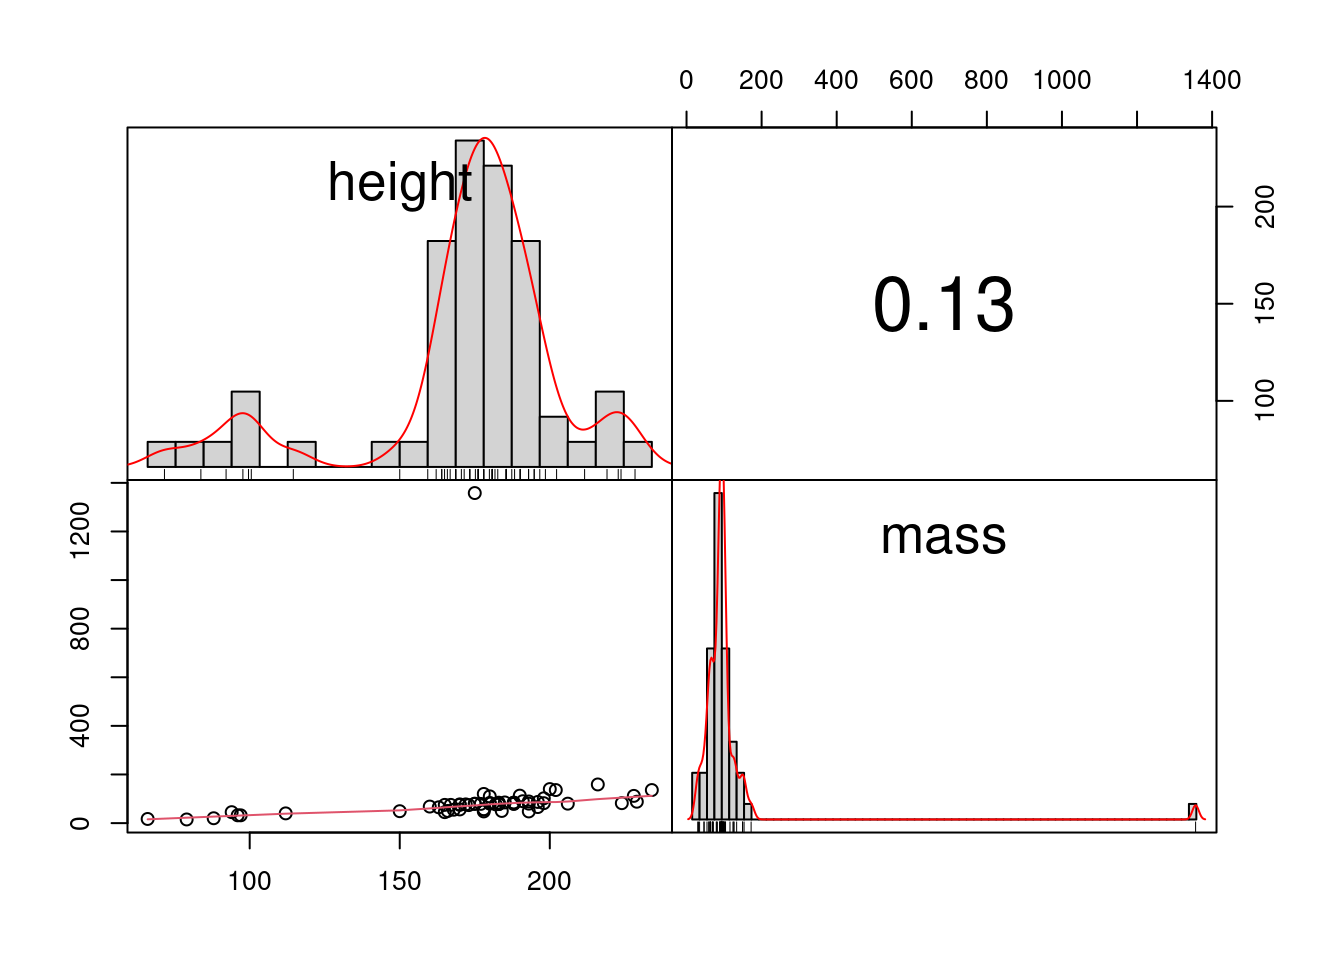
Visualizando as distâncias e subset
df_final |> ggplot(aes(x = height, color=`bacon$subset`)) + geom_dotplot()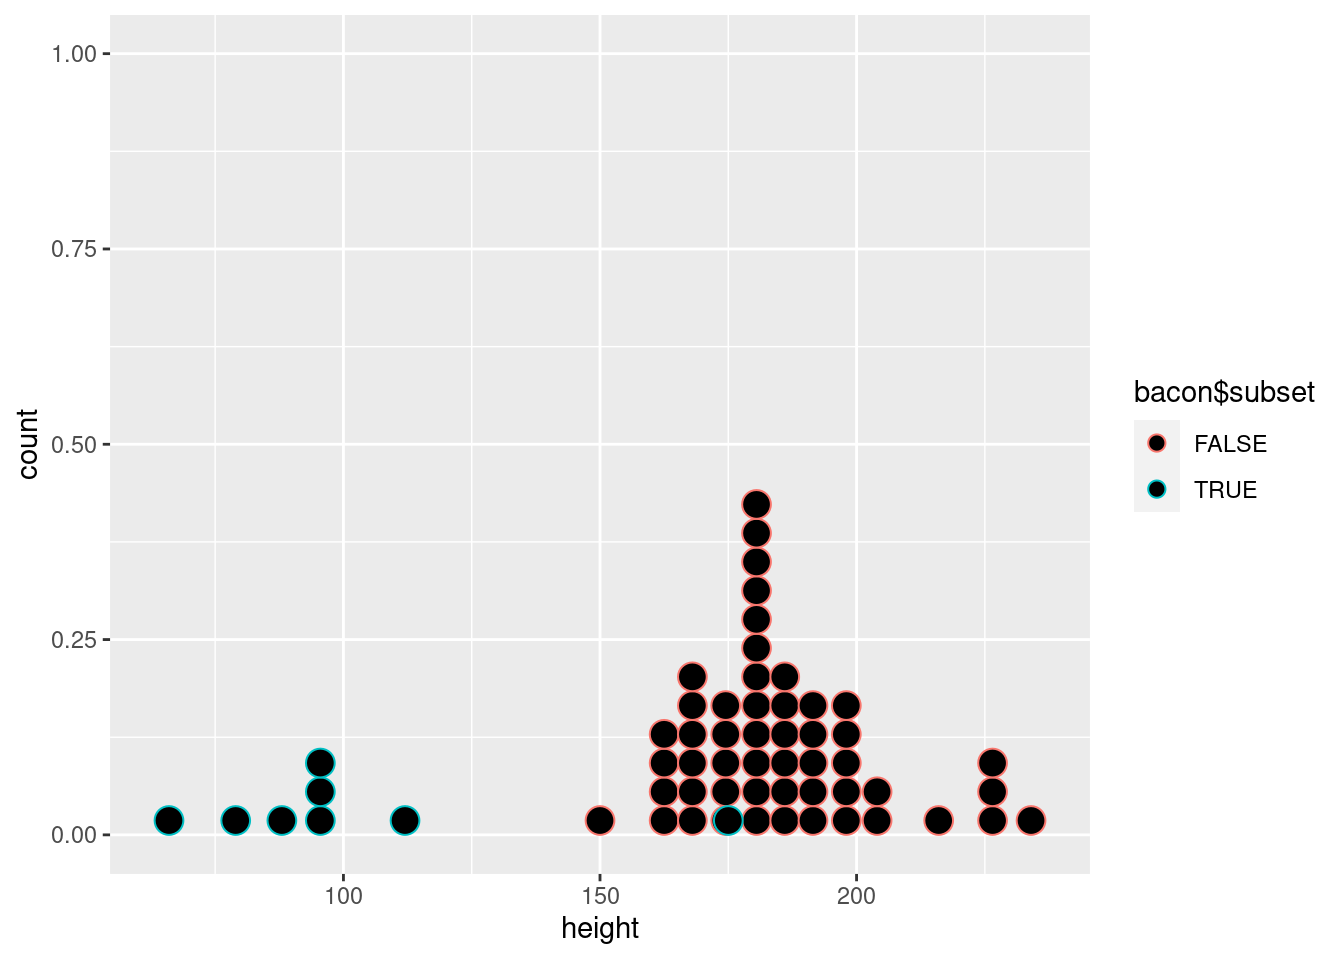
df_final |> ggplot(aes(x = height, y = mass, size= bacon$dis, color=`bacon$subset`)) + geom_point() + geom_text_repel(aes(label = name)) + scale_y_log10() + guides (color = guide_legend("Outlier")) + theme(legend.position = "bottom")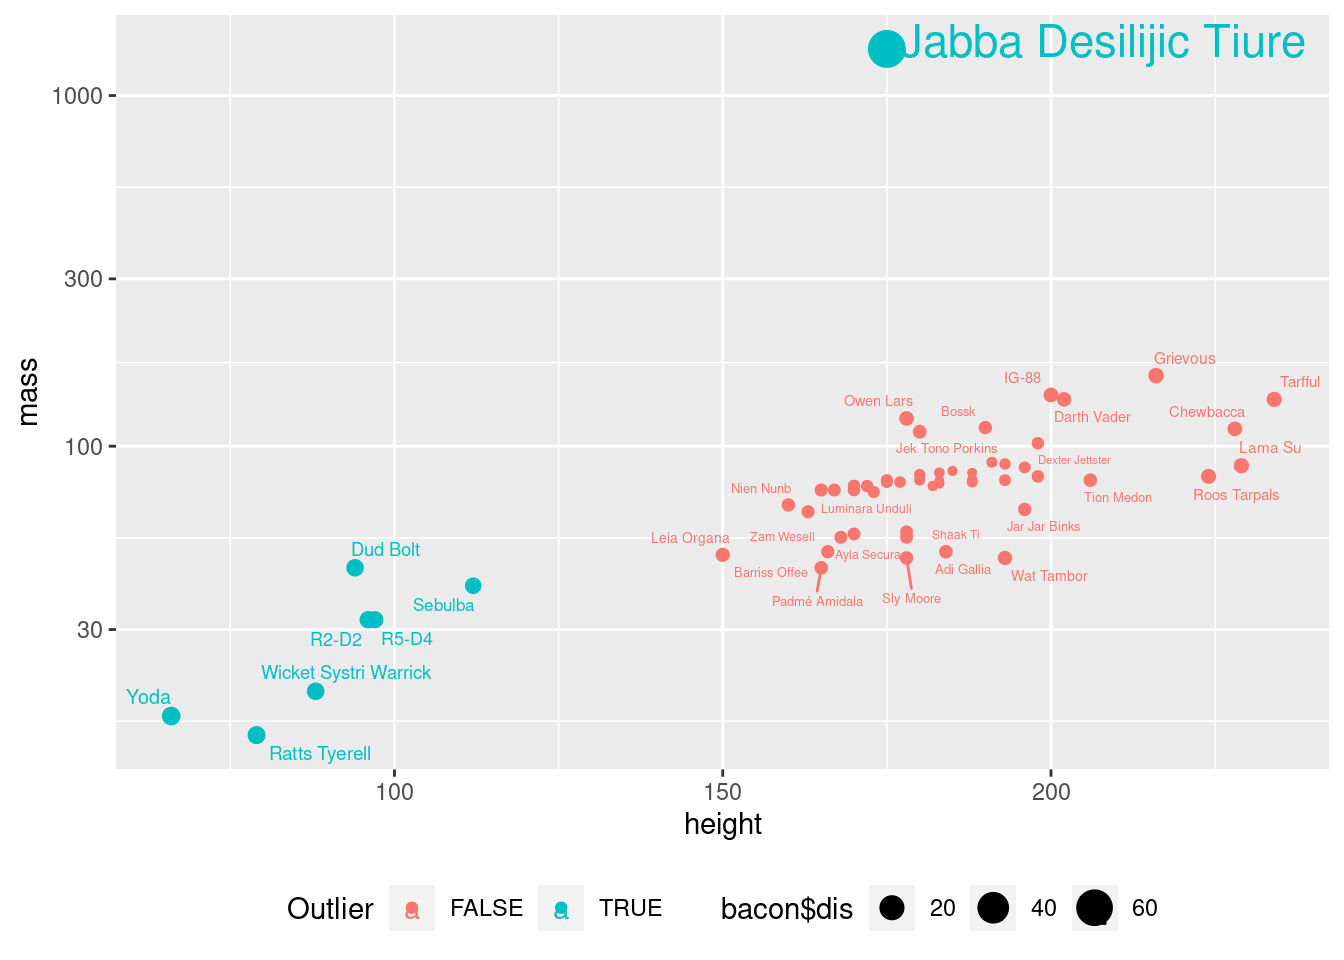
df_final |> ggplot(aes(x = height, color= `bacon$subset`)) +
  geom_point(aes(y = `bacon$dis`, size=`bacon$dis`, shape=`bacon$subset`)) +
  guides(colour = guide_legend("Outlier"),
         size = guide_legend("Distancia"),
         shape = guide_legend("Outlier"))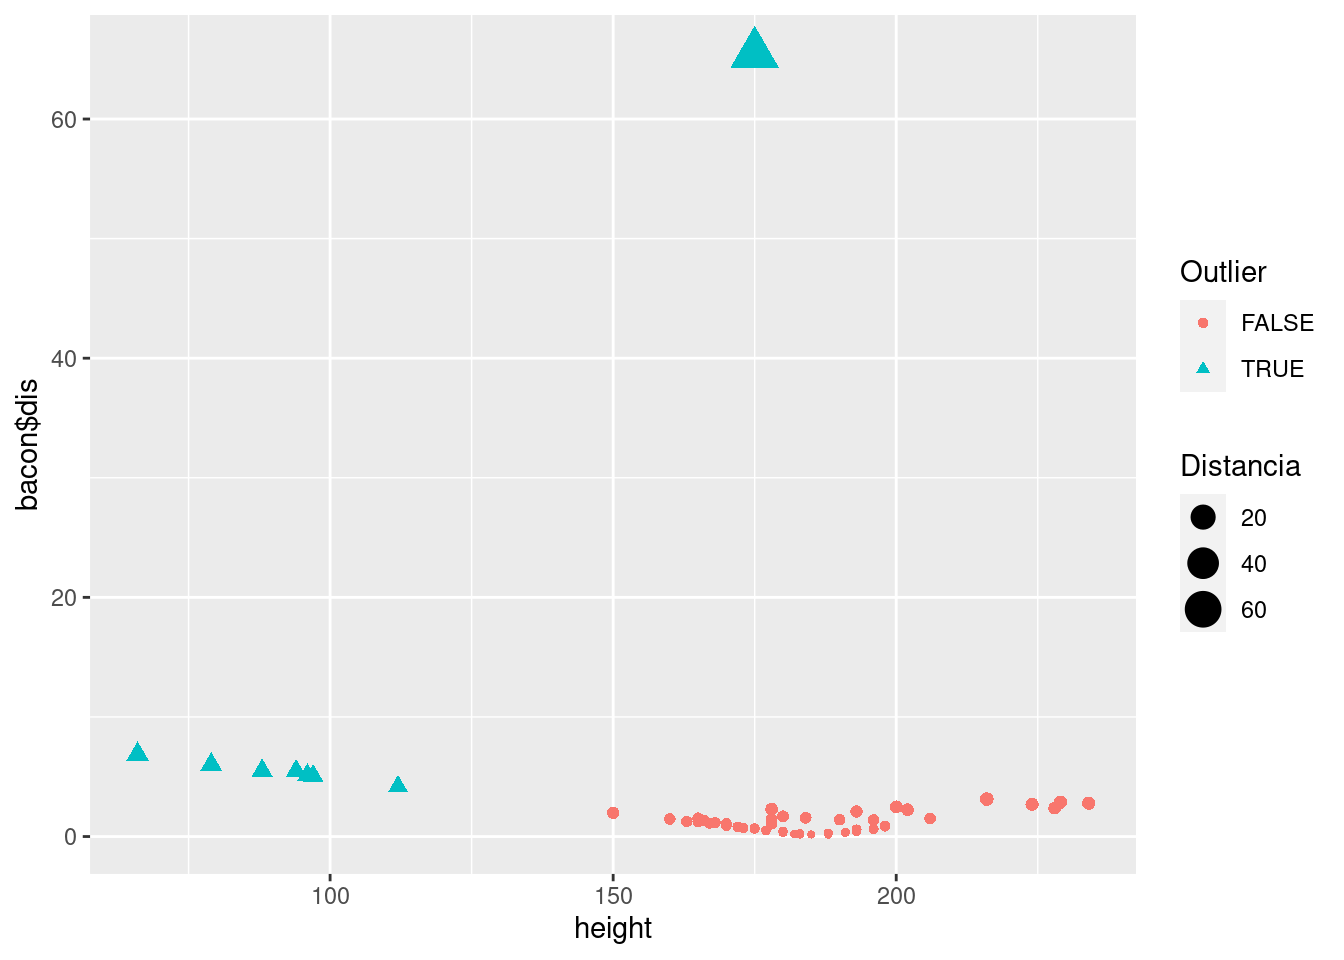
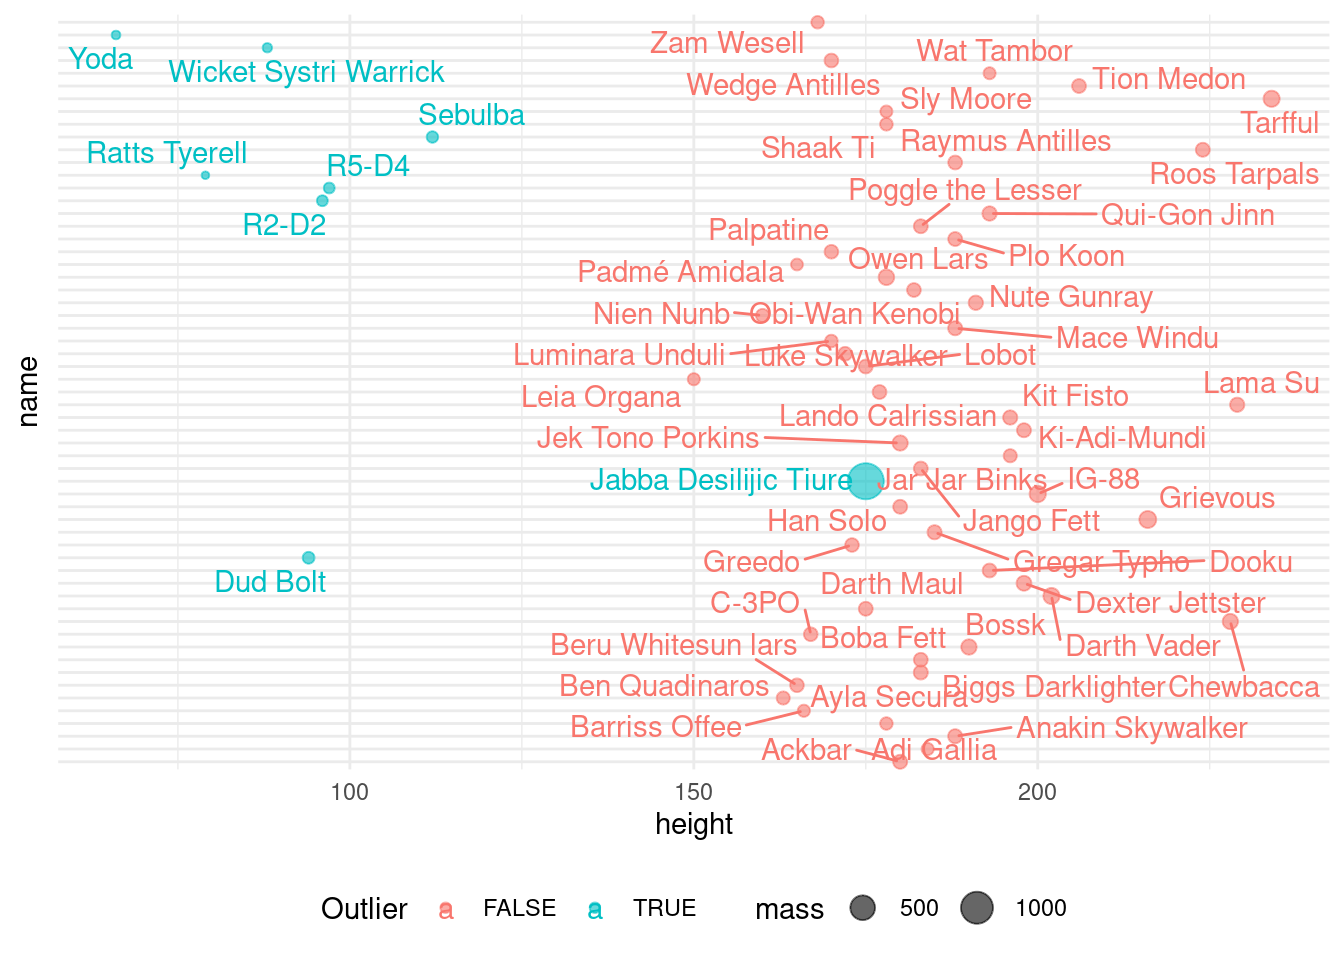
df_final |> ggplot(aes(x = height, y = name, color= `bacon$subset`)) +
  geom_point(aes(size = mass), alpha = 0.6) +
  geom_text_repel(aes(label = name)) +
  theme_minimal() +
  theme(legend.position = "bottom", axis.text.y = element_blank()) +
  guides(colour = guide_legend("Outlier"))